
Frenzy, Fallout, and the New Normal: NZ Art Market Performance
How sales doubled during the pandemic, how the top names still dominate, and whether stability or further correction lies ahead.
Last week we explored the top 10 most expensive artworks at auction (beyond McCahon and Goldie). This week, we’re going deeper into the auction data to better understand the overall art market in New Zealand.
Over the past 10 years, New Zealand’s art market has seen COVID-driven spikes, a new post-pandemic normal, and an outsized influence from just a handful of artists. Below, I’ll outline the conclusions and then go into the data that underpins them.
The pandemic peak (2021–2022) was extraordinary. Sales jumped 2.5x, with nine works breaking $1m, despite the number of auction lots not increasing. Instead, demand was the driver with sell-through rates also setting records. While it may not be a surprise that sales increased with us all at home, the magnitude of the increase is astounding.
Post-COVID reset (2023–2024) shows more lots and more artists at auction. Prices remain well above pre-pandemic levels, though below the frenzy of 2021 and 2022. Sell-through rates, however, have slipped back to pre-COVID norms.
Top 10 artists dominate. Year after year, they contribute ~50% of sales for the whole NZ art market. This has remained consistent pre, during, and post COVID. Within those headline names, the top 2 artists alone account for ~20% of sales in the NZ art market, though this is more volatile. Goldie and McCahon reign supreme with each appearing in the top 2 in seven of the last ten years, joined occasionally by Don Binney, Bill Hammond, Ralph Hotere… and Banksy.
Market concentration is real, but volatile. The top 10 works sold each year typically account for ~20% of sales. But can still fluctuate a lot year on year depending on what comes to market, for example, the combined value of the top 10 works increased by 55% from 2023 to 2024. This was mainly boosted by Goldie claiming 8 of the 10 most expensive works. But supply of high-quality McCahons has dried up, raising the question: was 2024 a blip or the start of a new phase?
Overall trend: COVID shocked the system, but prices have stabilised at a higher baseline, with more lots and more artists. Whether this is sustainable, or another phase before a further correction, is the question for 2025.
Total Sales Continue Climbing
The chart below shows data from the 3 largest auction houses (Art & Object, Webbs, and International Art Centre). It shows how much people paid for art at auction (the orange bars) and how many items were put at auction (the blue line).
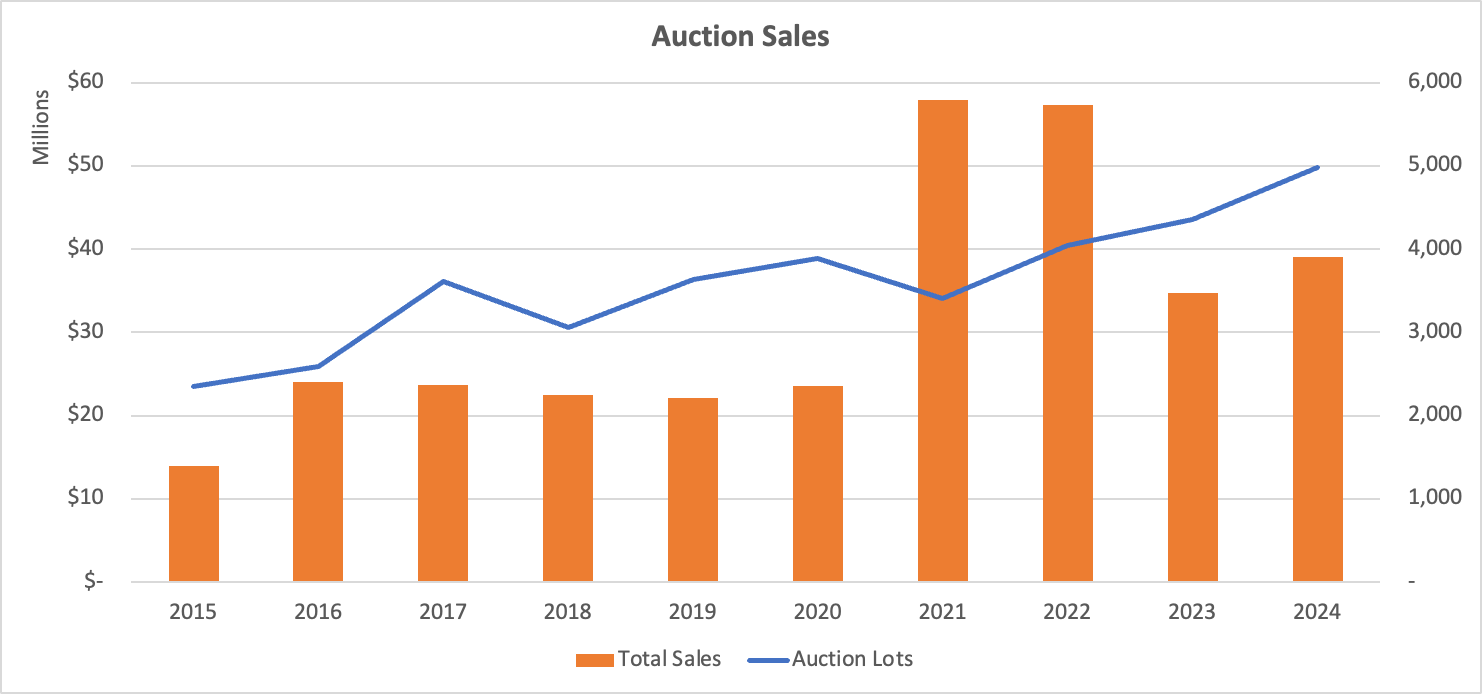
During COVID, sales volumes exploded. Between 2021–2022, money spent on art at auction more than doubled, despite the number of lots staying flat. There wasn’t more to buy, instead, buyers stuck at home were paying more for anything they could get their hands on, including nine New Zealand artworks selling for over $1 million each.
Post-COVID, the new norm looks higher than the long pre-2020 plateau. More art is coming to auction, and buyers are still spending more than they did pre-COVID, even if the frenzy has cooled.
So what? There has been a structural shift in the market. More art is being sold, and at higher aggregate values than before the pandemic.
Sell-Through Rates Have Peaked
The next chart looks at how many lots actually sold. Sell-through is a proxy for auction house success, buyer demand, and pricing accuracy.
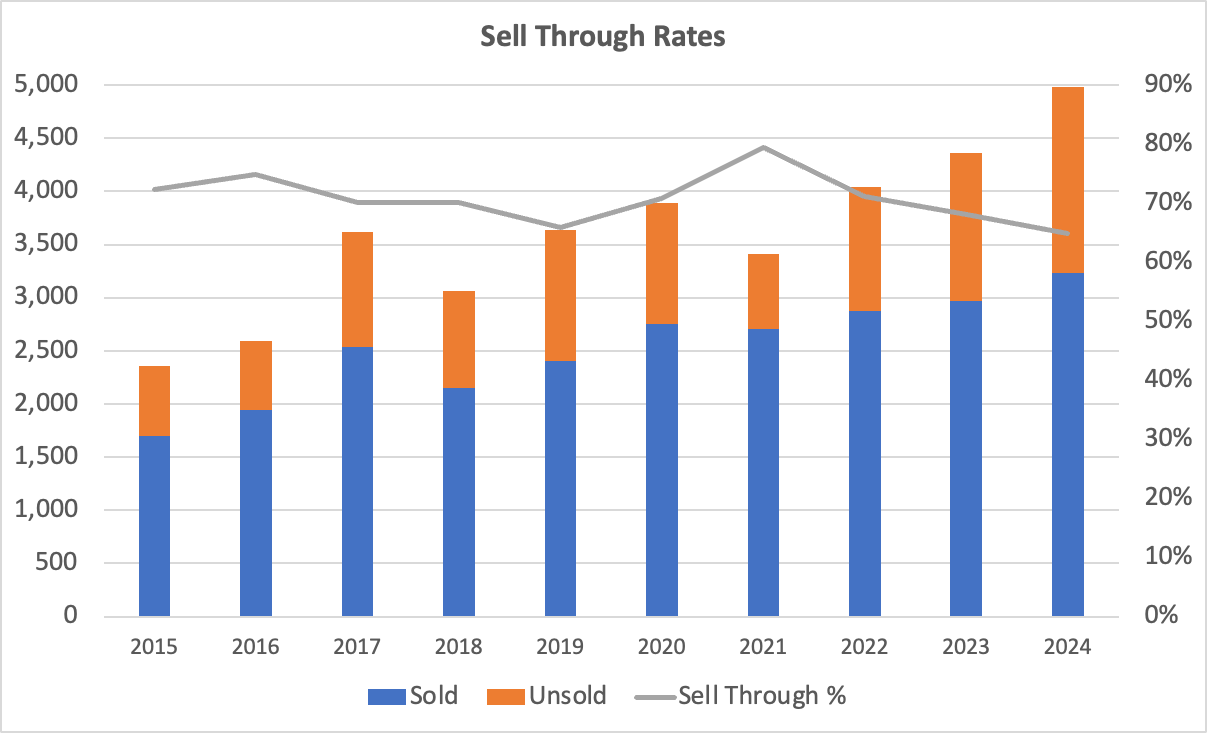
2021-2022: Extraordinary years, particularly in 2021, with sell-through rates at record highs. Even though fewer works came to market, nearly all of them sold.
2023–2024: Sell-through rates are falling below long-term averages. More works are on offer, but a smaller proportion are selling.
So what? Auction houses may now be pushing more supply than the market can fully absorb.
Individual Price Increases (and Decreases)
What about individual prices? Total sales have been increasing, but so have the number of lots available. With high inflation over the last five years, you’d expect prices to climb. Not necessarily.
In 2015, the average price was $8288 and the median was $2162. By 2024, the average price has increased by only 10% while the median price is down by over half to only $956. Again, we see a significant spike in prices in 2021 and 2022.
I wouldn’t expect such low increases (averages), or even negative changes (median), in price. This surprising result comes from more low-end works entering the market. As we’ve seen in the charts above, the number of works at auction doubled between 2015 and 2024, so has the number of unique artists.
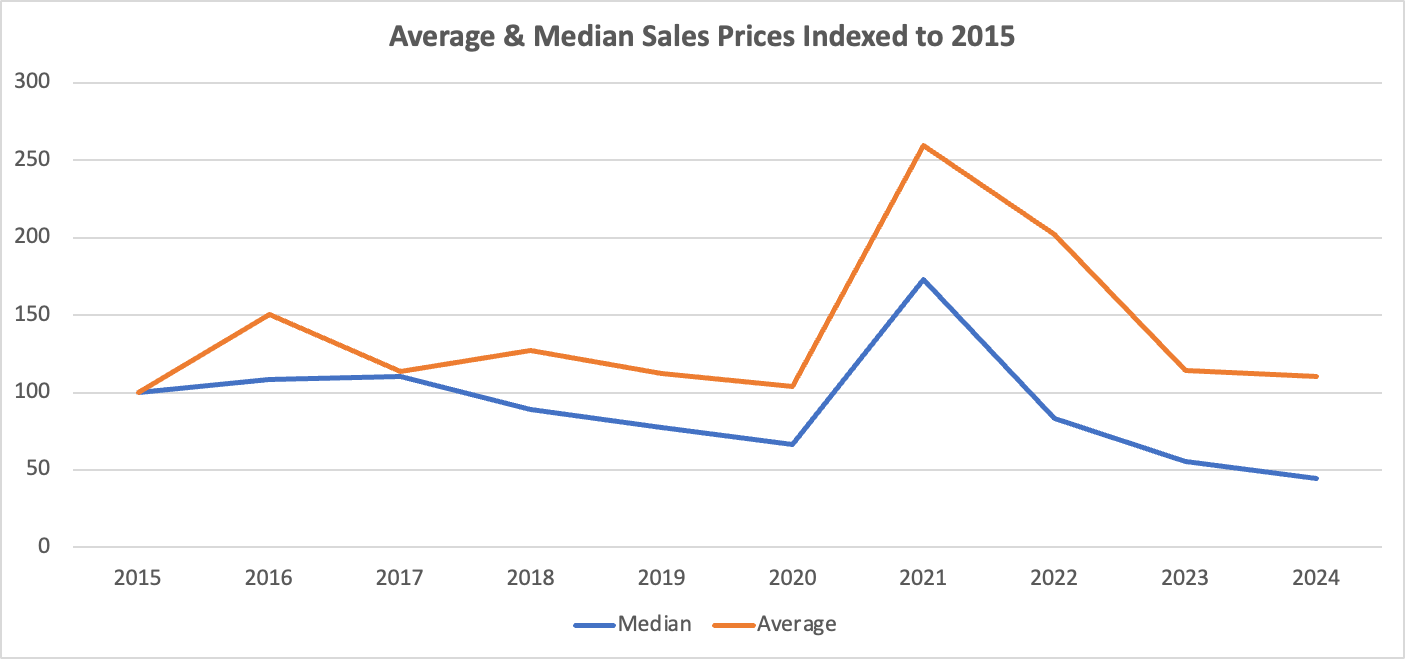
Looking at the broad high end market (the top ~25% of the market), at prices paid for the 5th, 10th, 50th, 500th, and 1000th most expensive work each year, we see a different pattern that better reflects what interests most collectors.
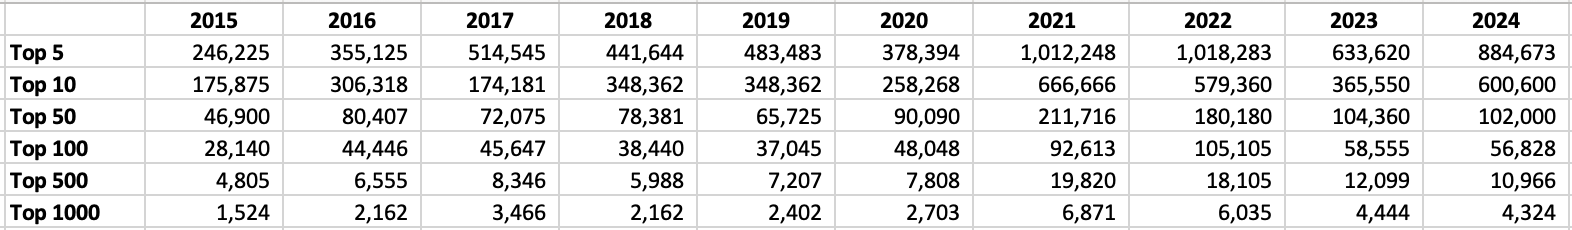
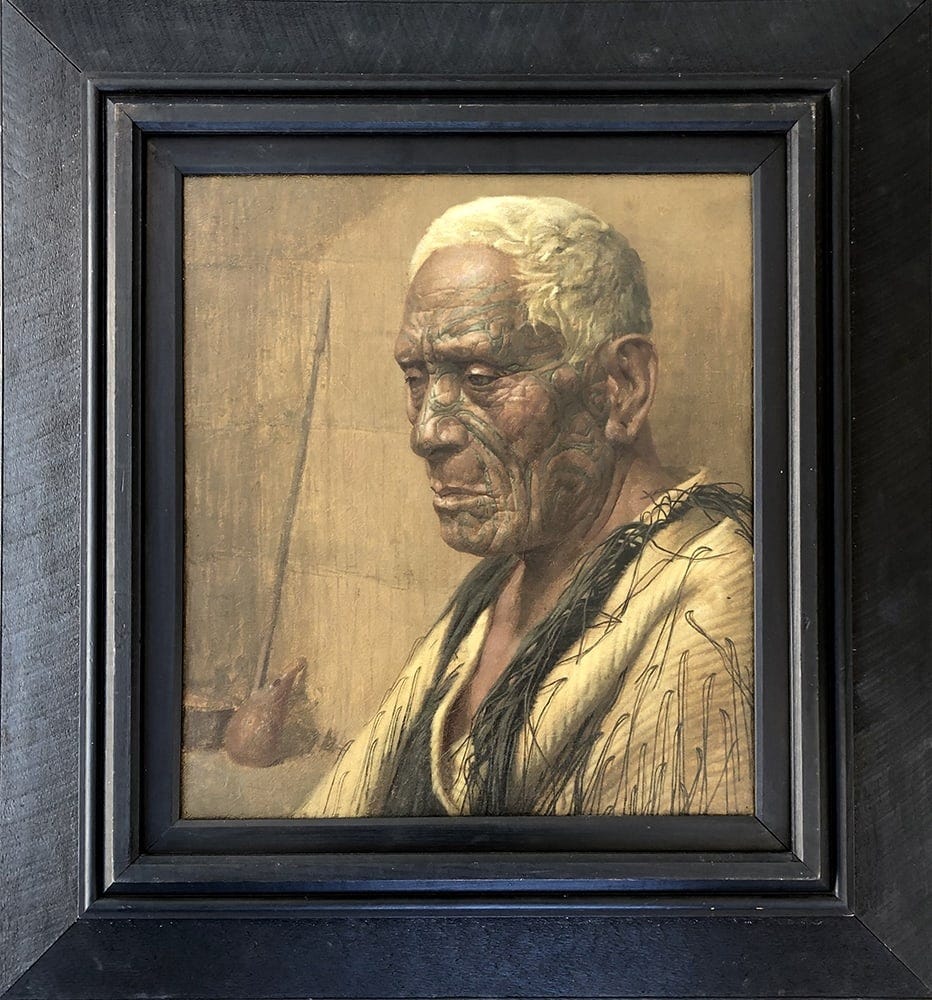
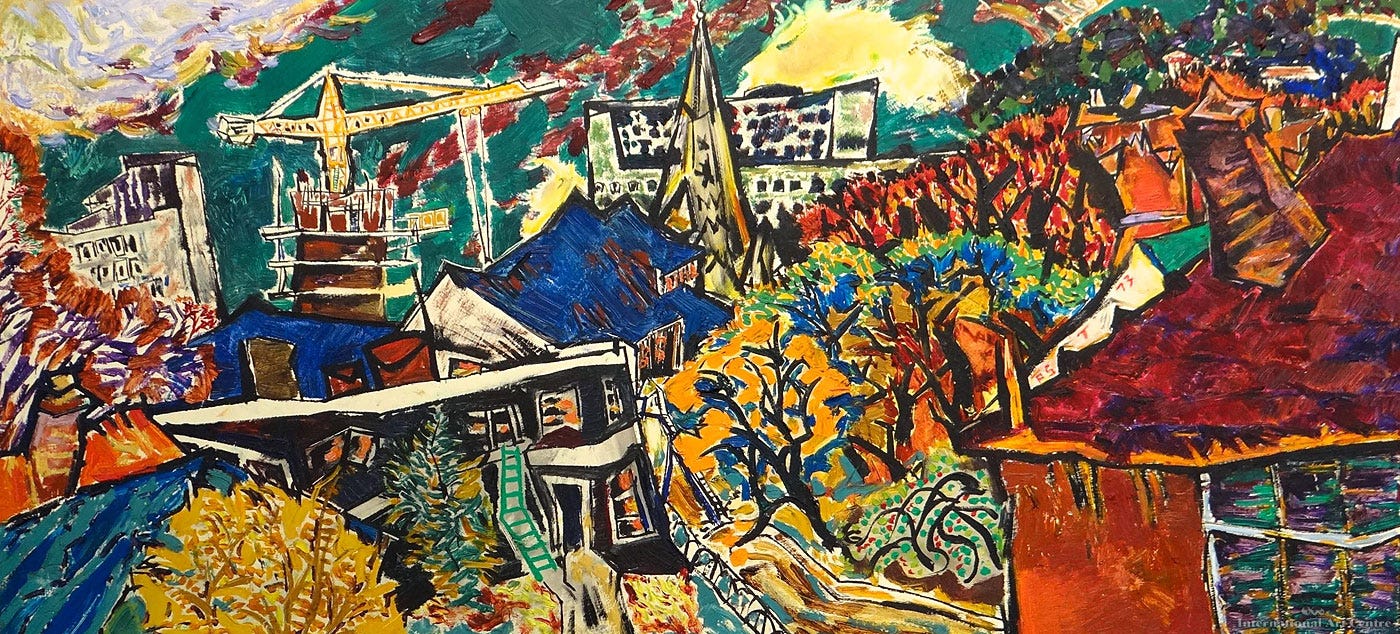
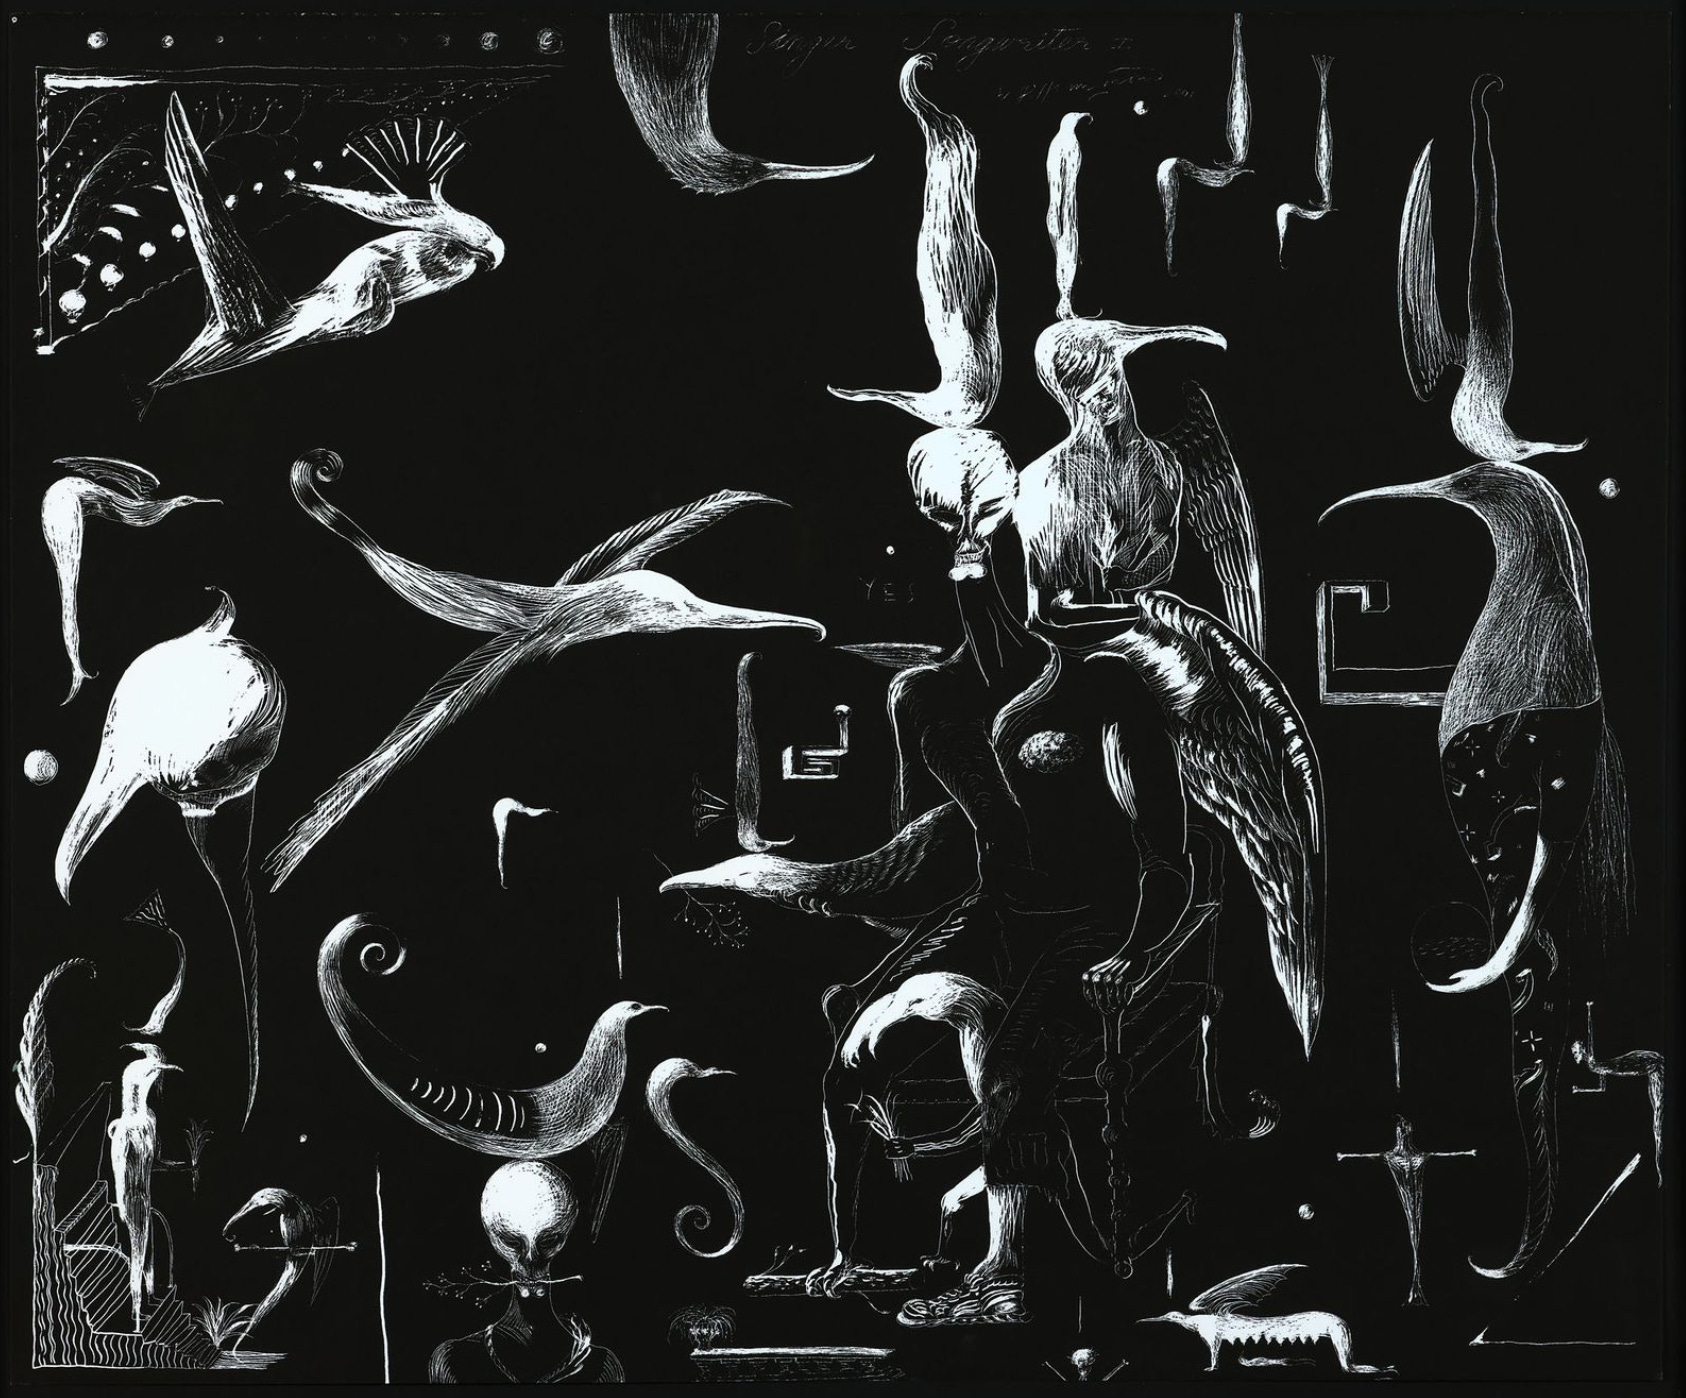
To illustrate this, an artwork ranked 500th cost ~$4,800 in 2015. By 2022, that same slot sold for ~$18,100 (nearly 4x higher). In 2024, it was ~$11,000 — still more than double 2015, but down from the COVID frenzy. And here’s what you would have bought:
These price trends are displayed for all categories in the chart below, all indexed to 2015.
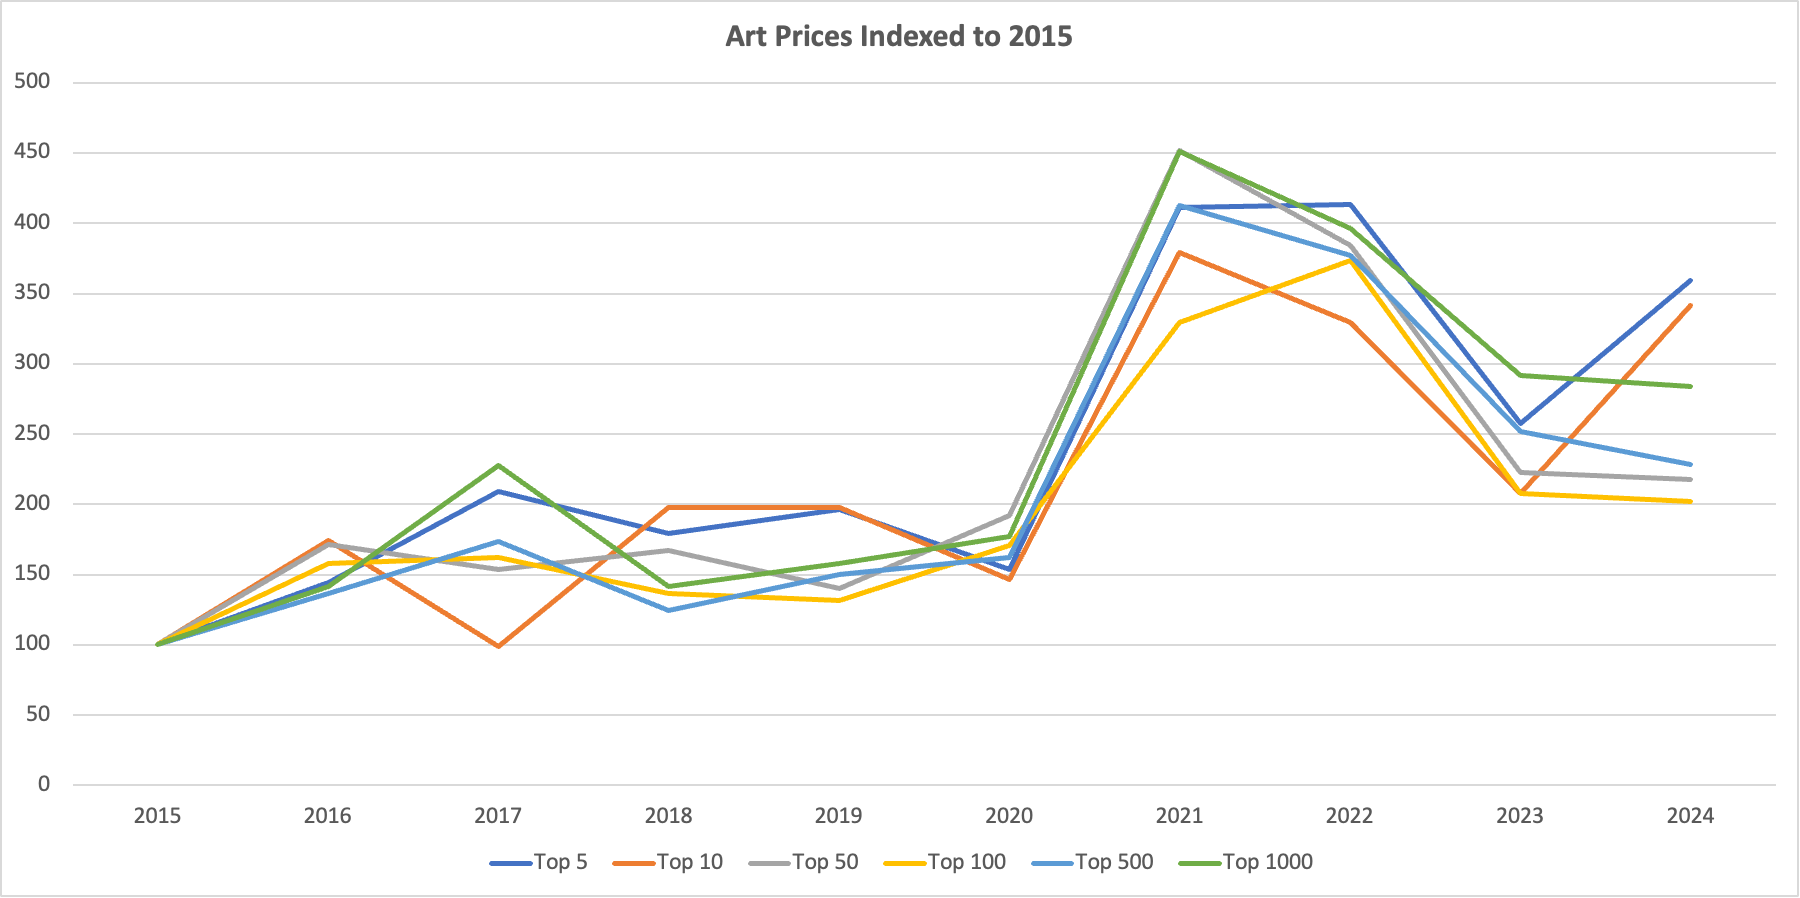
These price trends, indexed to 2015, show three phases: 1) small gains in prices between 2015 and 2020; 2) a significant pandemic peak with prices going up ~4x across the board; 3) 2023 and 2024 saw prices drop from COVID peaks, but remain elevated above pre COVID prices.
So what? The broader high end has reset higher, even as the low end drags down medians.
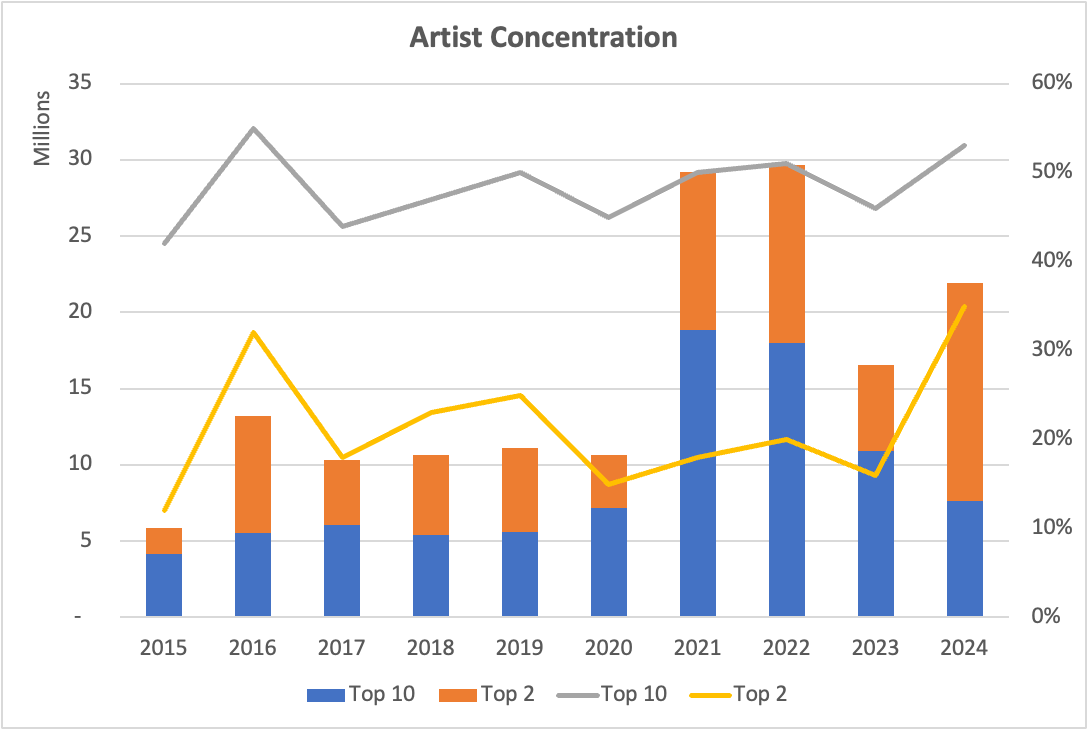
Concentration Amongst the Headline Names
The final area we’ll look at is concentration of the top artists and artworks, and how much they contribute to total sales.
The top 10 artists each year contribute almost 50% of sales. That’s been consistent across the last decade. The top 2 artists each year contribute around 20% (though this is more volatile). Charles Goldie and Colin McCahon each appear in the top 2 for 7 of the 10 years reinforcing the outsized impact these two artists have on the NZ market. The other artists appearing in the top 2 are Don Binney, Bill Hammond, Ralph Hotere, and Banksy.
That’s true whether you look at artists or individual works. We see a similar trend across the top 10 artworks each year. They have consistently contributed between 20 - 25% of total sales over the last decade. Again, those 8 Goldies in the top 10 sold in 2024 cause the spike in contribution to 30%.
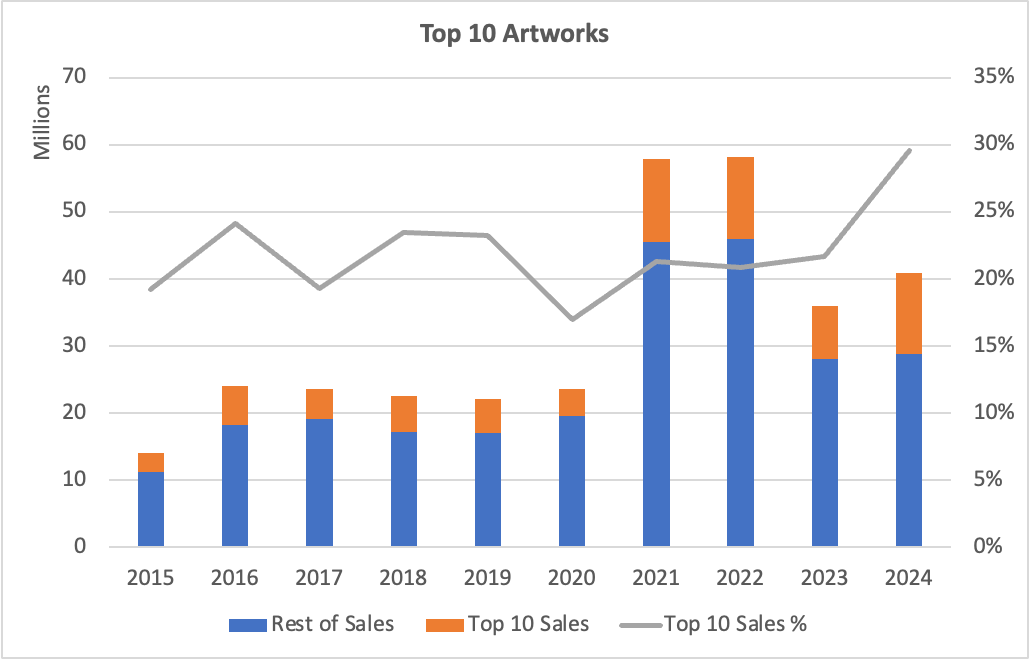
So what? While the market has broadened, it is still highly dependent on a small group of names and artworks to influence sales.
Final Thoughts
Looking back over the decade, the COVID boom stands out as a sharp anomaly. But rather than collapsing back to old levels, the market seems to have reset on a stronger footing: more lots, more artists, and prices that remain well above the mid-2010s.
At the same time, concentration hasn’t shifted much. Half the value still comes from just 10 artists, and the dominance of Goldie and McCahon remains a defining feature. That can make the very top end volatile; a few masterpieces (or their absence) can tilt the entire year’s results.
For collectors, timing matters. Pre-COVID buyers are generally sitting on gains, peak buyers may struggle, and today’s buyers face a more measured market. Stability, rather than runaway growth, looks like the likeliest near-term path for auction sales. Though as always, much depends on what works come to auction.
With art markets softening overseas in 2025, the big question is whether New Zealand has found its equilibrium or whether further correction lies ahead. With Artnet releasing its mid-year intelligence report, later this month we will take a similar look at the New Zealand market in 2025 and how it aligns with Artnet’s report.