
Trophies, Trends, and Turning Points: A Decade of Australian Art Auctions
Top-tier works are soaring, the market is tightening, and a handful of artists now command almost half the value. Here’s how to understand Australia’s reshaped auction market.
Over the last couple of weeks we’ve focused on 20 of the most expensive works sold in Australia. This week, we zoom right out to take a 10 year long view of art in the Australian auction market, from the multi-million dollar trophy artworks through to the artworks within reach of everyday collectors.
Australia’s art market shares similarities with New Zealand, but also some important differences. First, the Australian market is much larger: roughly double the size of New Zealand’s, with significantly more high-value results. In 2024 alone, Australia saw 14 artworks sell for $1m+ AUD and a further 154 for $100k+ AUD, compared with New Zealand’s 2 artworks over $1m NZD and another 48 over $100k NZD (if adjusted for currencies, the gap would widen further).
Second, while Australia did experience a lift during the pandemic, it was nowhere near New Zealand’s dramatic spike. And because the rise was more restrained, Australia avoided the sharp “reset” that followed in New Zealand. If anything, the Australian market has emerged stronger, steadier, and more selective.
One common thread through this analysis is that, despite arguably softer sales overall, the very best works have continued to find buyers at ever increasing prices.
The analysis below is taken from selective auction results across five major art auction houses in Australia: Deutscher & Hackett, Smith and Singer, Menzies, Bonhams, and Leonard Joel. All prices below are in AUD. Further notes on the methodology at the end.*
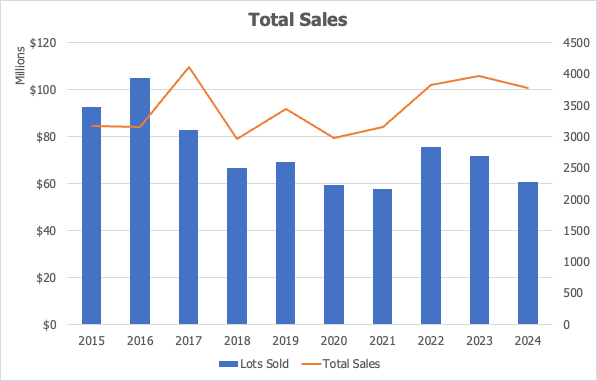
Total Sales: A Slowdown, then a Rebound
The Australian auction market grew steadily until 2017, peaking at around ~$104m in total sales. Then a came four year subdued period:
2018 - 2019: the economy suffered with weak property prices and slow wage growth that curbed the wealth and confidence of many potential buyers,
2020 – 2021: COVID further dampened confidence and also impacted supply.
The market then rebounded in 2022 – 2023, with sales once again topping $100m, matching pre-pandemic highs (despite fewer lots being sold). And although 2024 saw a pull back from 2022 and 2023, sales still remains above the long term average.
These high sales figures are being generated from fewer lots than in earlier years. It’s not immediately clear whether this reflects rising prices across the market or stronger performance at the top end. The deeper analysis below helps answer that question.
Unlike New Zealand, which saw a sharp pandemic lift in 2021-2022 and then a clear reset, the Australian market saw more restrained buying during the pandemic that also avoided a corresponding correction. Two factors in particular influenced this: 1) there wasn’t the same number of artworks flooding the market; 2) the inflationary hype driving prices well above pre-pandemic averages was not as extreme in Australia.
Sell-Through Rates: First Signs of a Market Cooling
Sell-through rates have typically sat between 70% to 80% over the last ten years. These rates peaked during the pandemic going just above 80% in 2021, reflecting fewer lots coming to market and stronger buyer competition for what was available.
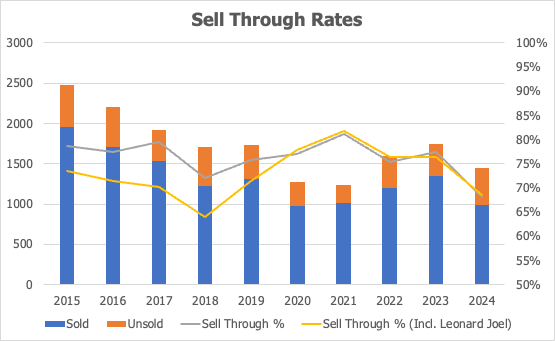
The concern is 2024 (and 2025, though not depicted above), where rates have slipped below 70%, despite fewer works coming to market. Not every auction house is affected equally, but the aggregate trend is unmistakeable.
As we’ll see below, high quality works still sell and are continuing to achieve record prices. But with fewer lots coming to market and falling sell-through rates, it’s indicative of a cooling market, though one in which the absolute best works still remain in demand. The silver lining for collectors is that with fewer works selling at auction, there are opportunistic buying conditions if you know what something is worth.
Individual Prices: A Split Market Emerges
Average and median prices
Despite softer overall sales between 2018 and 2021, both the median and average sale prices have climbed steadily across the decade. Prices paid today are more than double what they were in 2015.
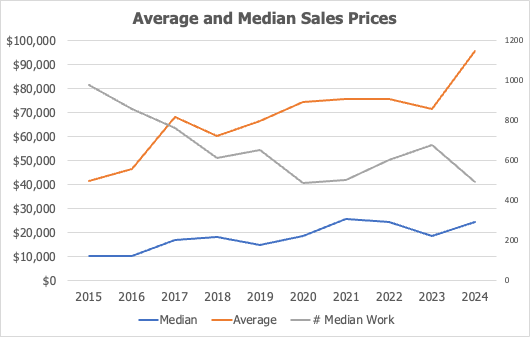
The median has been pushed higher partly because fewer works are being offered. With a smaller pool of lots, the midpoint of the market climbs. The “# Median Work” measure shows how far down the results you need to go to hit that midpoint and it has shifted noticeably upward over the last 10 years.
Index Tiers: Top 5 → Top 1000
More revealing is the price index for the 5th, 10th, 50th, 500th, and 1000th most expensive work each year. This gives a far more nuanced view of which parts of the market have actually grown and which have not.
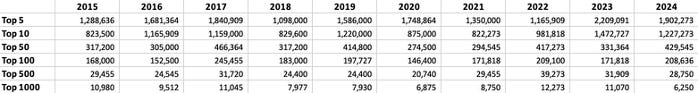
The table above shows the raw numbers; the chart below indexes them to 2015 to make the growth rates easier to compare over the decade.
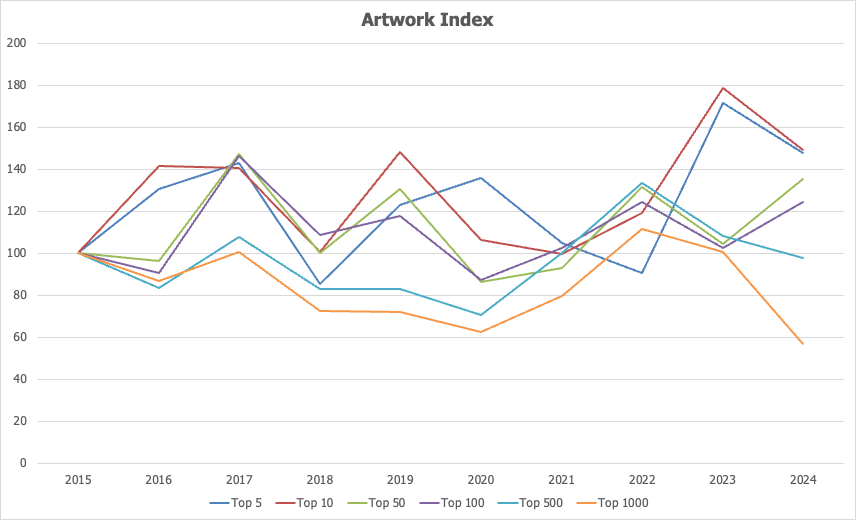
While the exact rates vary depending on the timeframe, the pattern is clear: the strongest appreciation has occurred at the very top.
Top 5 / Top 10: ~6% annual growth. Dipped in 2020–2022, surged to new highs in 2023, and remain well above long-term levels despite a softening in 2024.
Top 50 / Top 100: ~2% annual growth. A bumpier path, dipping in 2020, peaking in 2022, easing in 2023, and rising again in 2024.
Top 500 / Top 1000: Flat over the decade. After a brief 2021–2022 surge, prices have fallen back, with the Top 1000 now at a 10-year low — suggesting casual collectors have stepped away.
This confirms that the market is diverging: premium works are attracting premium spending, while average works are getting average interest.
Concentration: A Market Rules by a Few Names
Sales are concentrated amongst the top artists. Brett Whiteley is in a league of his own, contributing more than $80 million in sales over the last ten years, including the record-setting Henri’s Armchair (2020) which sold for $6.1 million. Sidney Nolan and Fred Williams each add another ~$50m over the decade. The three of them together have averaged 19% of yearly sales over the last decade, though this has fluctuated between 10% and 30%.
Extending this view to the top 10 artists, they have delivered, on average 43% of total sales. Rounding out the list of top 10 artists are Arthur Boyd, Jeffrey Smart, Arthur Streeton, Charles Blackman, John Brack, John Olsen, and Howard Arkley. It’s incredible to see how a small handful of artists and artworks contribute so significantly to the overall market.
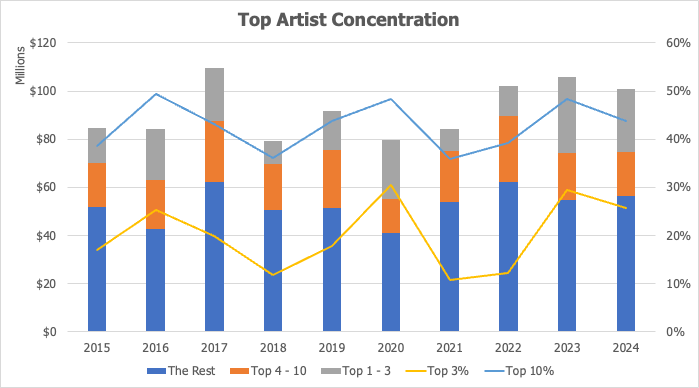
And the top 10 artworks have contribute an average 18% of the total sales each year over the last decade. Though in 2023 and 2024 this increased above 20%, again, reinforcing the view that the top end had found confidence coming out of the pandemic. Interestingly, this concentration amongst the top 10 artworks is higher in New Zealand, despite the much lower prices achieved. This is a reflection of the much smaller art market in New Zealand.
It will be interesting to see how demand shifts at the top end, particularly which names collectors will be chasing. I expect to see more women feature strongly in this top tier…
Female Artists: Breaking Records, Not Yet the Ceiling
Recognition of female artists made real gains, the share of sales attributed to female artists has steadily grown over the last decade. Though they still represent a small slice of top-end results. Four women broke the $1m barrier: Emily Kame Kngwarreye (with Earth’s Creation 1 at $2.1m), Ethel Carrick Fox (The Market at $1.46m), Bronwyn Oliver (Tide at $1.23m), and Rosalie Gascoigne (Beaten Track at $1.04m).
Meanwhile, contemporary artists Cressida Campbell and Del Kathryn Barton now routinely hit the $300k–$500k range, with fresh records set in the last couple of years.
The momentum is real but the ceiling is not broken yet. There are fewer works, fewer consignments, and fewer headline prices compared to their male counterparts. But there has been a continued shift towards female recognition from museums and collectors expanding their focus.
Aboriginal Art: A Resilient Market
Sales of art by Aboriginal and Torres Strait Islander artists has followed a similar trend to the broader market, with a drop in number of lots in recent years, indicating higher prices being paid for the best works. The segment is led by Emily Kame Kngwarreye, whose 2017 result remains the highest price for an Indigenous artwork sold in Australia.
Lin Onus dominated contemporary results, with multiple works in the $500–800k range. Rover Joolama Thomas, Albert Namatjira, and Paddy Nyunkuny Bedford all saw strong, if more modest, results.
Aboriginal art has a steady presence at auction. Breakout prices are still rare, but institutional and collector interest is rising, particularly with the prominence of Emily Kame Kngwarreye’s exhibition at the Tate Modern. I think this is one of the more interesting segments in the Australian market to watch.
Final Thoughts
Australia has largely avoided the dramatic rise and correction seen in New Zealand and is now moving into a more considered, quality-focused phase.
This is a selective market with the best works continuing to command extraordinary prices, while activity in the middle and lower tiers is steady but subdued. Concentration remains high, and although female and Indigenous artists are increasingly visible, they are still underrepresented in the top tiers.
Turnover remains respectable, but 2024 has clearly cooled. Next month, I’ll take a comprehensive look at the 2025 auction year and the signals it sends for 2026.
Methodology
* The analysis is taken from the auction results across five major art auction houses in Australia: Deutscher & Hackett, Smith and Singer, Menzies, Bonhams, and Leonard Joel. A few specific callouts: 1) Leonard Joel specialises in the lower end of the market - its average sale is under $5k, whereas Deutscher and Hackett, Smith & Singer, and Menzies each average $50k or higher; 2) Leonard Joel comprises about 50% of the lot volume (and this is after I’ve excluded its weekly art sales). To prevent certain data being skewed, I’ve removed Leonard Joel from some analyses above. I’ve called this out where relevant; 3) Smith and Singer was previously Sotheby’s Australia until the end of 2019, after which there was a notable drop in volume.
† The chart above depicts sell-through rates, which shows how many artworks actually sold at auction. Leonard Joel averages just over 50% of the lots I’m analysed, so to prevent too much skew, I’ve removed Leonard Joel to prevent skew in this chart (except for the trend line where it’s specifically included). As you can see it tracks lower before the pandemic, but then converges with the other auction houses.
A fabulous overview of the Australian art market.