
This analysis is an excerpt from the 2025 Australian Fine Art Auction Market Report and the 2025 New Zealand Fine Art Auction Market Report. A comprehensive, data-driven review of the year’s key results, trends, and pricing signals.
This week compares Australia and New Zealand using the same Artwork Price Index methodology. The two markets are closely connected, but the data shows they are currently at different points in the cycle.
The Artwork Price Index tracks the selling price of the 10th, 50th, 100th, 500th, and 1,000th most expensive artworks sold each year. To illustrate a bit further, the 100th most expensive work sold in the Australian auction market in 2025 would have cost you $282,000 AUD, while in New Zealand, the 100th most expensive work would have ‘only’ cost you $55,000 NZD (~$45,000 AUD).
The index is a useful complement to headline results because it shows how pricing is moving across the market, not just at the very top. It also avoids the distortions that can affect median prices, which are heavily influenced by the volume of low-value works. All points are indexed to 2021, making year-to-year comparisons consistent.
Taken together, the Australian and New Zealand indices show two neighbouring markets moving in different directions. Australia’s recovery has been led by strength at the top and upper-middle of the market, while New Zealand remains well below its 2021–22 highs, with softness still evident through the middle and lower tiers.
Australia
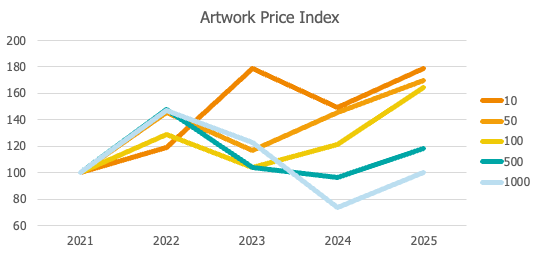
At the top end, the index continues to rise. The 10th most expensive work in 2025, Arthur Streeton’s La Salute at $1,472,727 AUD, sits near the peak of the series (comparable to 2023). Arguably more interestingly are the next tiers down where the 50th and 100th price points have been consistently trending upwards (aside from a 2022 spike), indicating that strength is not confined to a small number of trophy lots. Depth is improving across the upper middle of the market.

Further down, the pattern is different. The 500th and 1,000th price points surged in 2022 (with the rest of the market), softened through 2024, and only partially recovered in 2025. Indexed to 2019 or 2020, the 2021–2023 period shows clear inflation at these lower tiers, so the pullback in 2024 reads more like normalisation after an unusually hot run.
Overall, the index points to a market that strengthened again in 2025, led by the top and upper-middle tiers, while the lower tiers stabilised after resetting from the 2022 spike. In this respect, the Australian market looks more confident than New Zealand and many global markets, which were generally more cautious through much of 2025.
New Zealand
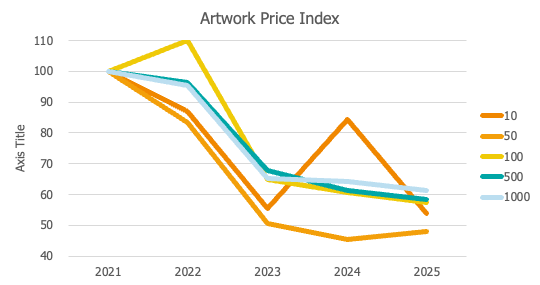
At the top end of the index, the 10th most expensive work in 2025, Bill Hammond’s Cornwall Road Cave, sold for $358,500 NZD. This is materially lower than the equivalent price points seen in 2021 and 2022, and well below the Arthur Streeton work in 10th place in Australia (and not that much more than the 100th most expensive work sold in Australia). As the sharp rebound in 2024 demonstrated, this tier remains highly sensitive to the specific works that come to market in any given year.

Further down the index, the 50th most expensive work recorded a modest increase compared with 2024, but still traded at around 50% below its 2021 level. Prices at the 100th, 500th, and 1,000th positions declined for the second consecutive year and now sit approximately 40% below 2021 levels.
The message from New Zealand is less upbeat. While price levels appear to have stabilised, further softening across the middle tiers suggests buyers remain cautious, likely reflecting ongoing cost-of-living pressures and broader economic uncertainty. This stands in contrast to Australia where prices have been increasing over the last few years across all tiers.
Conclusion
There are two important takeaways from this data.
The first is the direction of the markets. Australia entered 2026 with greater depth and confidence, particularly above the middle of the market, while New Zealand is still working through the after-effects of the pandemic-era surge. In both markets, the very top remains highly dependent on what comes up for sale, but the deeper price points tell the more important story: Australia’s market is rebuilding while New Zealand’s has stabilised at a lower level and is yet to bounce back from the pandemic highs.
The second is the size and affordability of the market. There is no doubt that the Australian market is bigger and has more depth. It’s population is larger with greater wealth that contributes to supporting higher possible prices. This is telling when the 10th most expensive work in New Zealand is only a little more expensive than the 100th most expensive in Australia. A similar comparison plays out for the 100th work in New Zealand compared to the 500th work in Australia. An alternative, and perhaps more promising, view for collectors is that the New Zealand market provides greater affordability for fantastic works.
Methodology: Data has been compiled from six Australian auction houses (Art Leven, Bonhams, Deutscher and Hackett, Leonard Joel, Menzies, and Smith & Singer) and four New Zealand auction houses (Art & Object, Webb’s, International Art Centre, and Dunbar Sloane). The analysis covers auctions held between 1 January 2025 and 31 December 2025 and includes only sales primarily focused on fine art.
Extensive efforts have been made to ensure the accuracy of the data; however, as with all large datasets, some errors or omissions may remain.